


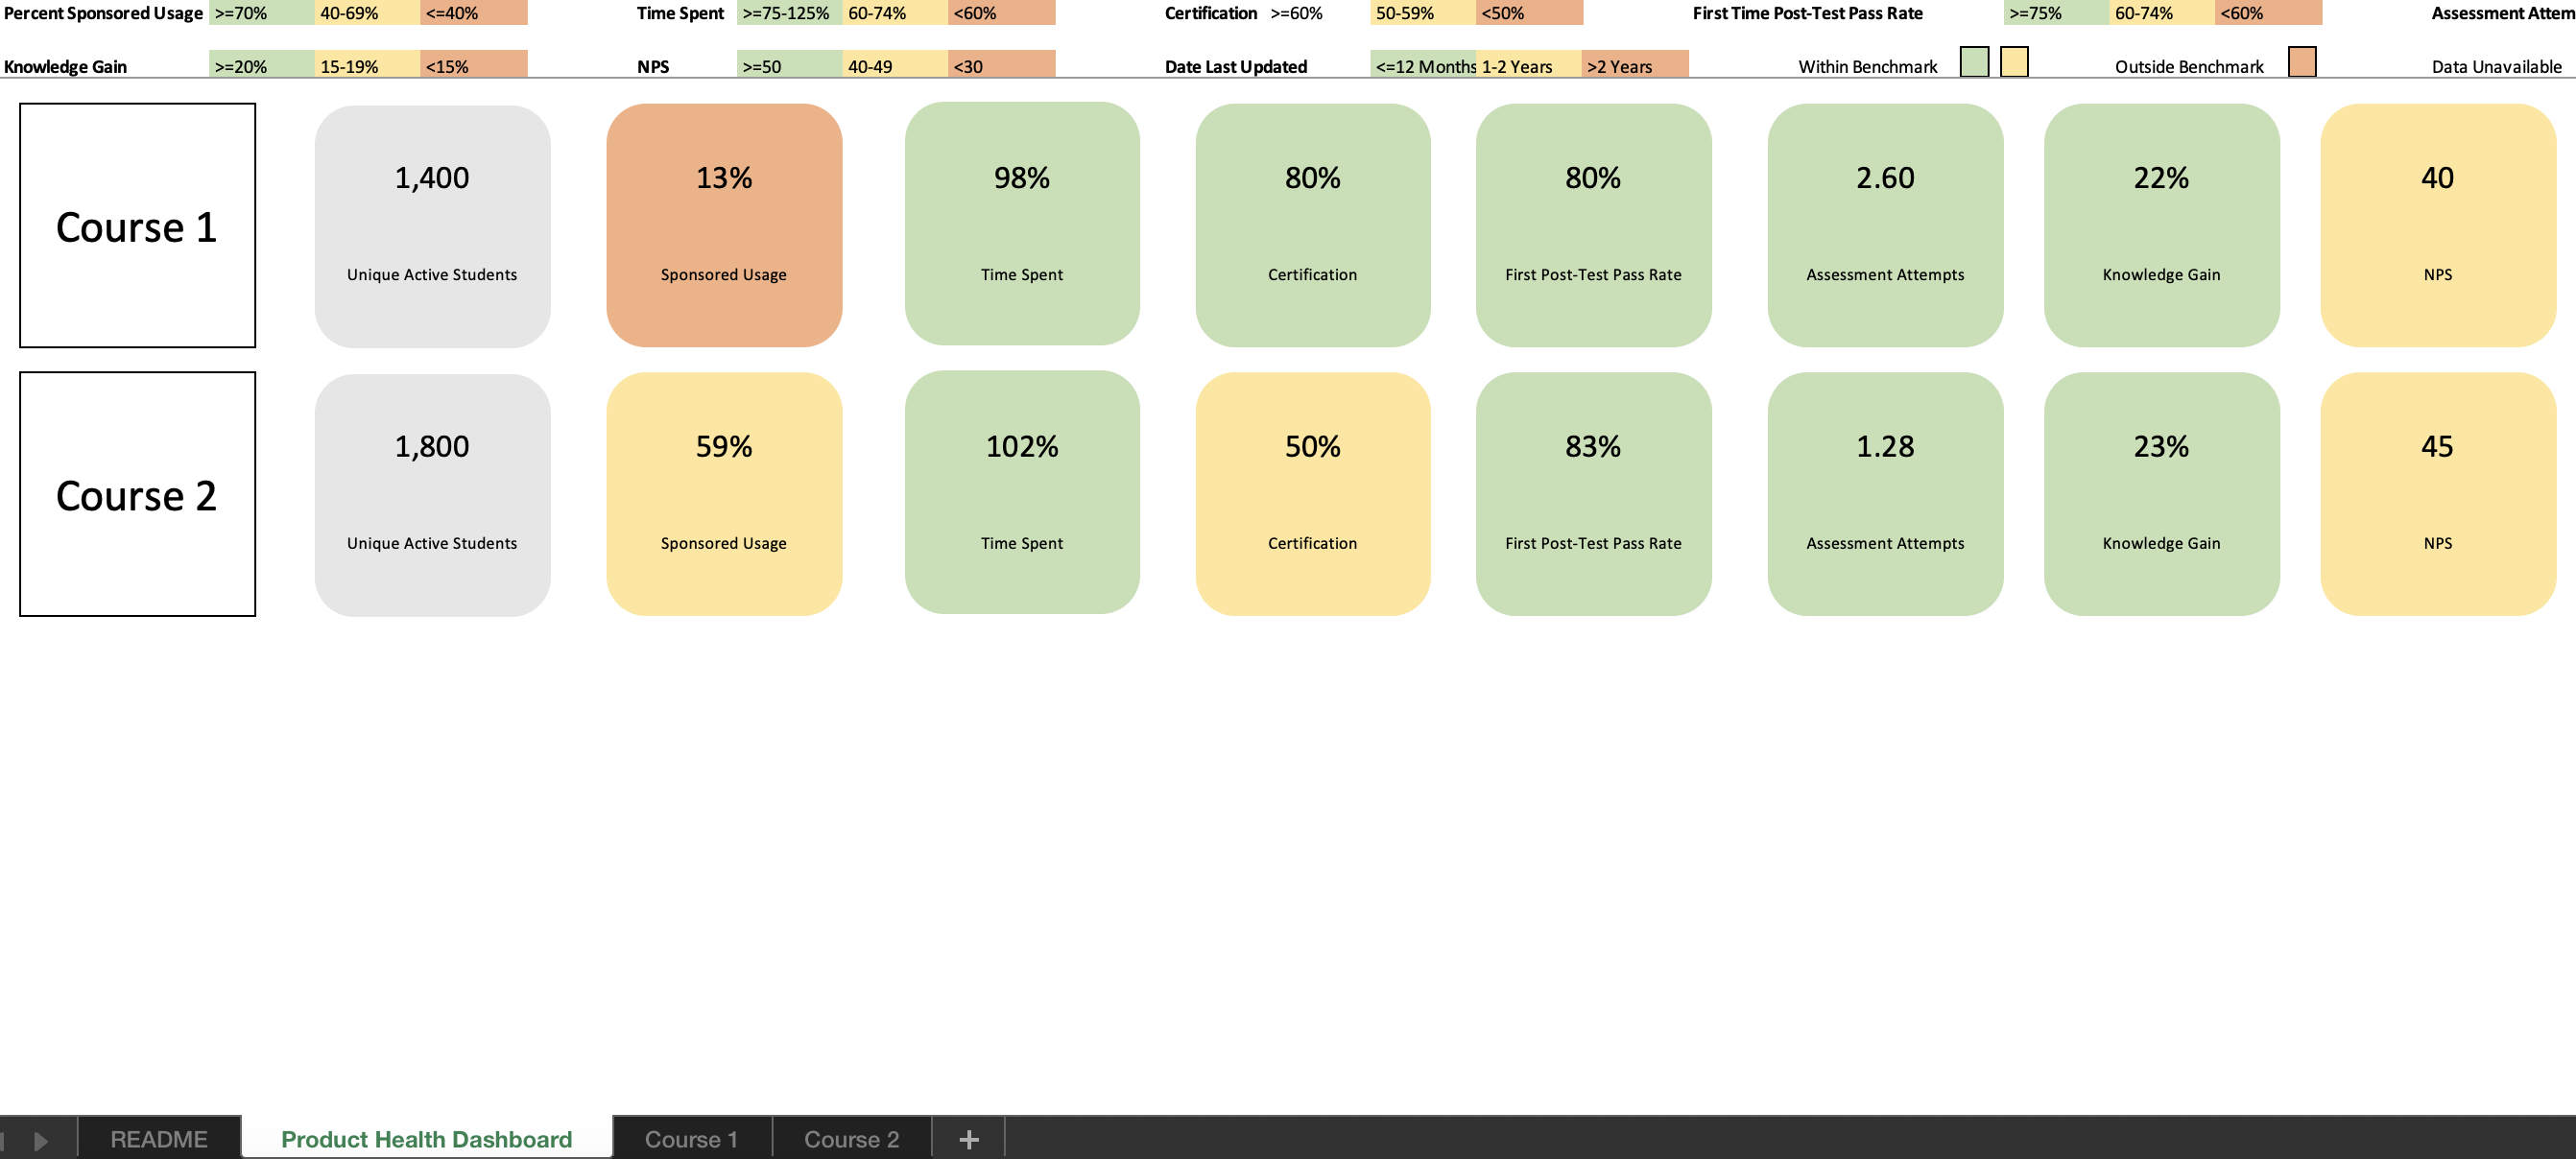
The purpose of the product health dashboard was to provide a comprehensive reference of important data metrics about an educational product for internal stakeholders to view. The dashboard was organized in Excel by a description of each key performance indicator, a visualization of how each course in the product performed against benchmarks, and a detailed breakdown of metrics for each course. Through these spreadsheets, stakeholders could quickly understand how the product is currently doing and what steps can be taken to improve metrics on the next development cycle.
I joined the team to improve the product health dashboard to make it more accurate, up-to-date, and relevant. In the current iteration of the dashboard, data was static and manually pulled as an interim reference while a live version was being developed.
Personally, my goal with this project was to get familiar with the product and using Heap!
I approached the improvement of the product health dashboard through two prongs: time-related updates, and metric-related updates.
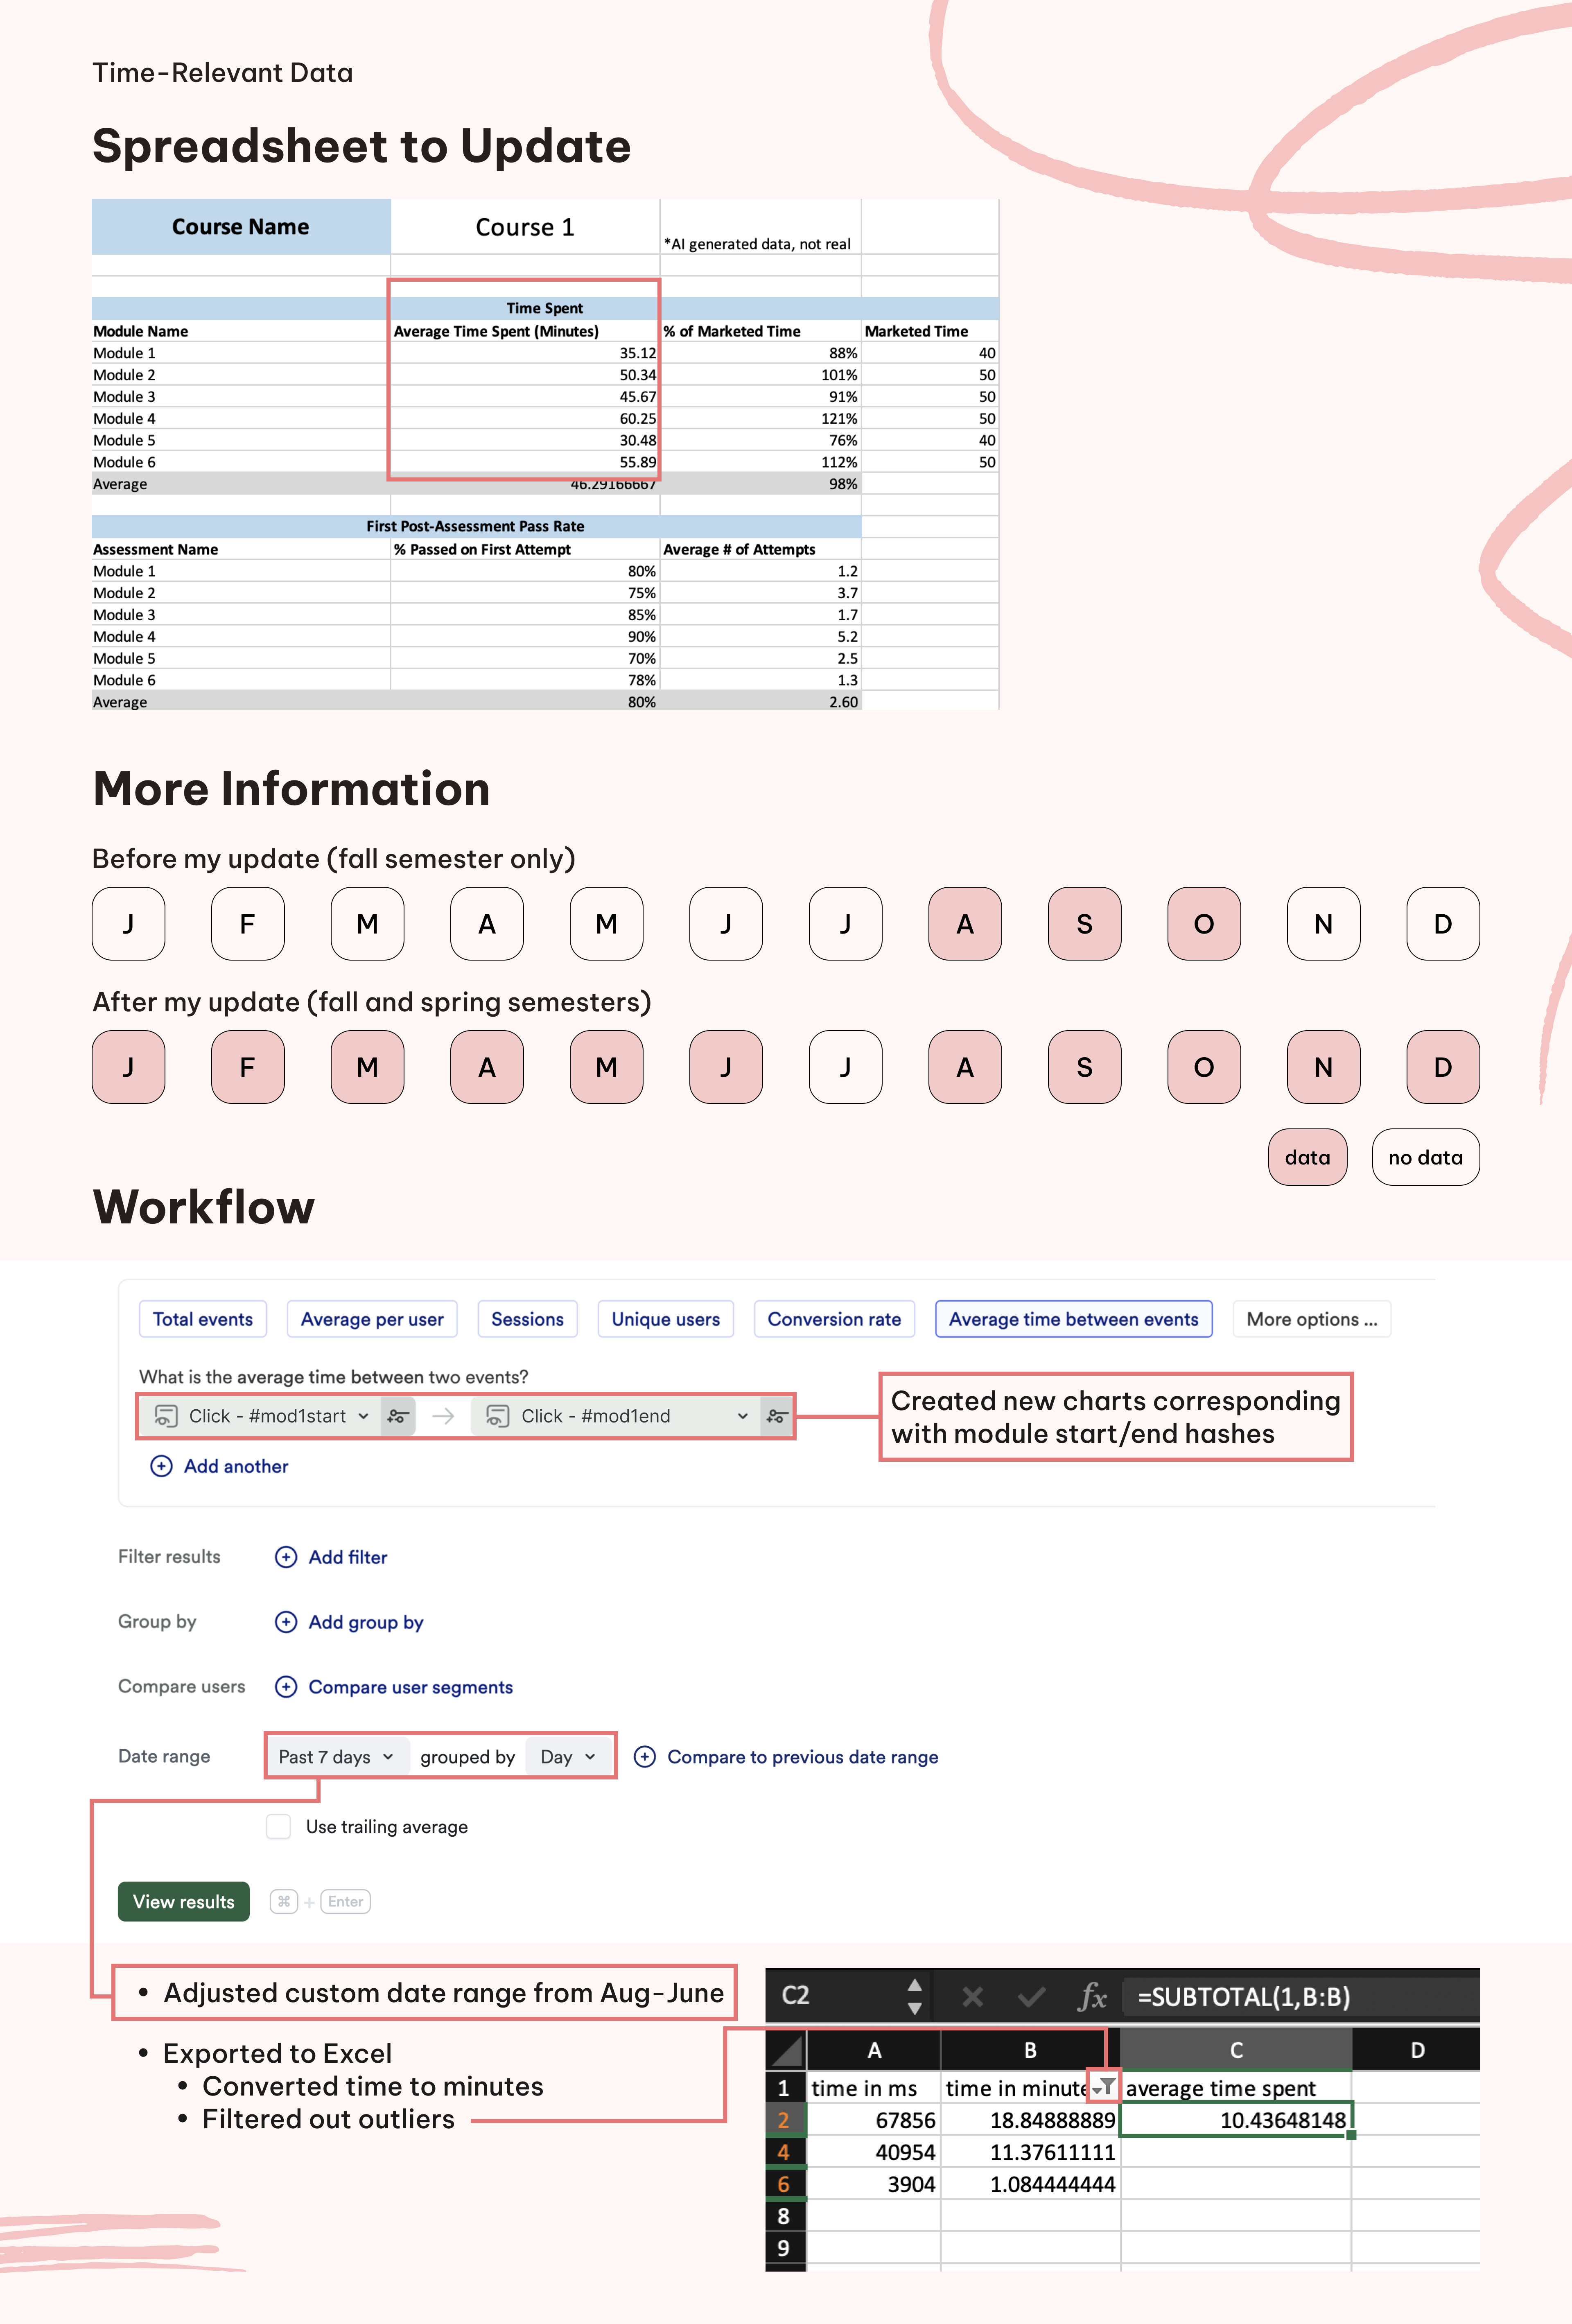
More time-relevant data was needed because the existing dashboard was only reporting on data from one semester of a school year for the “average time spent” metric. However, having data for a whole school year would provide more information to generally understand the wellbeing of the product — especially considering many of the courses were used in elementary schools, where students stay in the same class from the fall to spring.
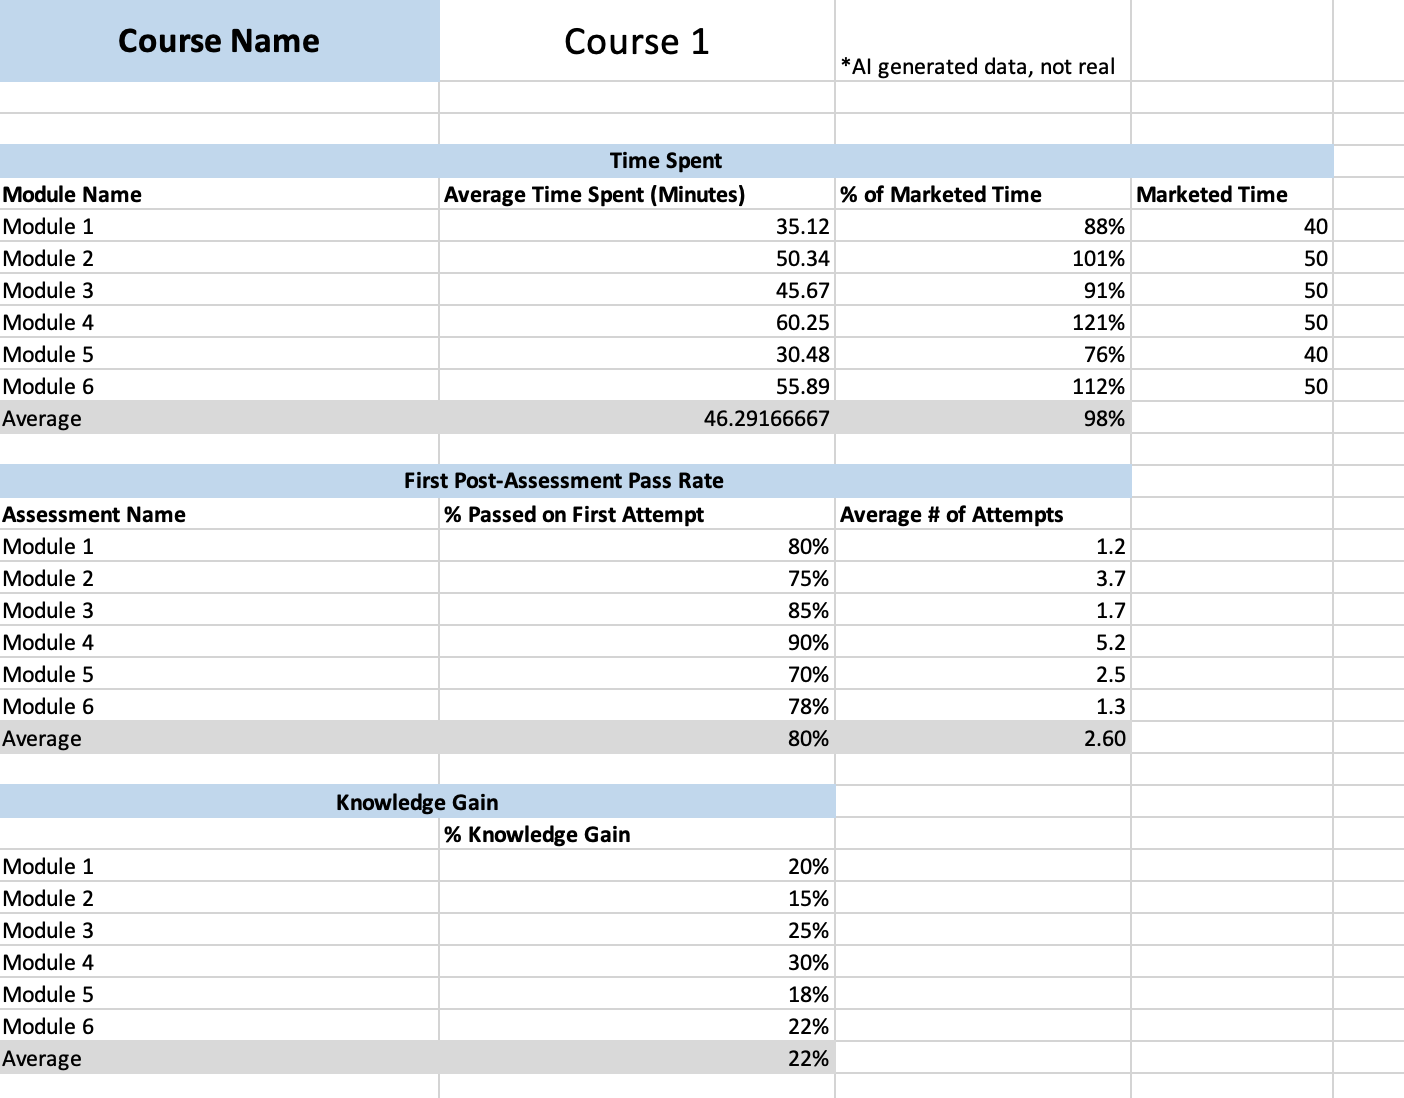
In the product health dashboard, each course could be further broken down into modules, where each module had an outdated measure of the average time spent. Using the module names, I looked at where data was being tracked in Heap and widened the date range before exporting data to Excel for more refined filtering. I identified outliers in the case of students idling on a module for several hours or days, which would be measured as larger time values than expected. None of the modules were predicted to take longer than an hour, so by excluding outliers, I could approximate how long students were actively engaging with module content.
However, I was missing information as some of the modules were not live tracked in Heap. I reached out to my direct manager for support, and she gave me an overview of finding the relevant hashes, which I used to create new charts. I continued with the same procedure as above, filtering in Excel to update the dashboard with a more accurate time.
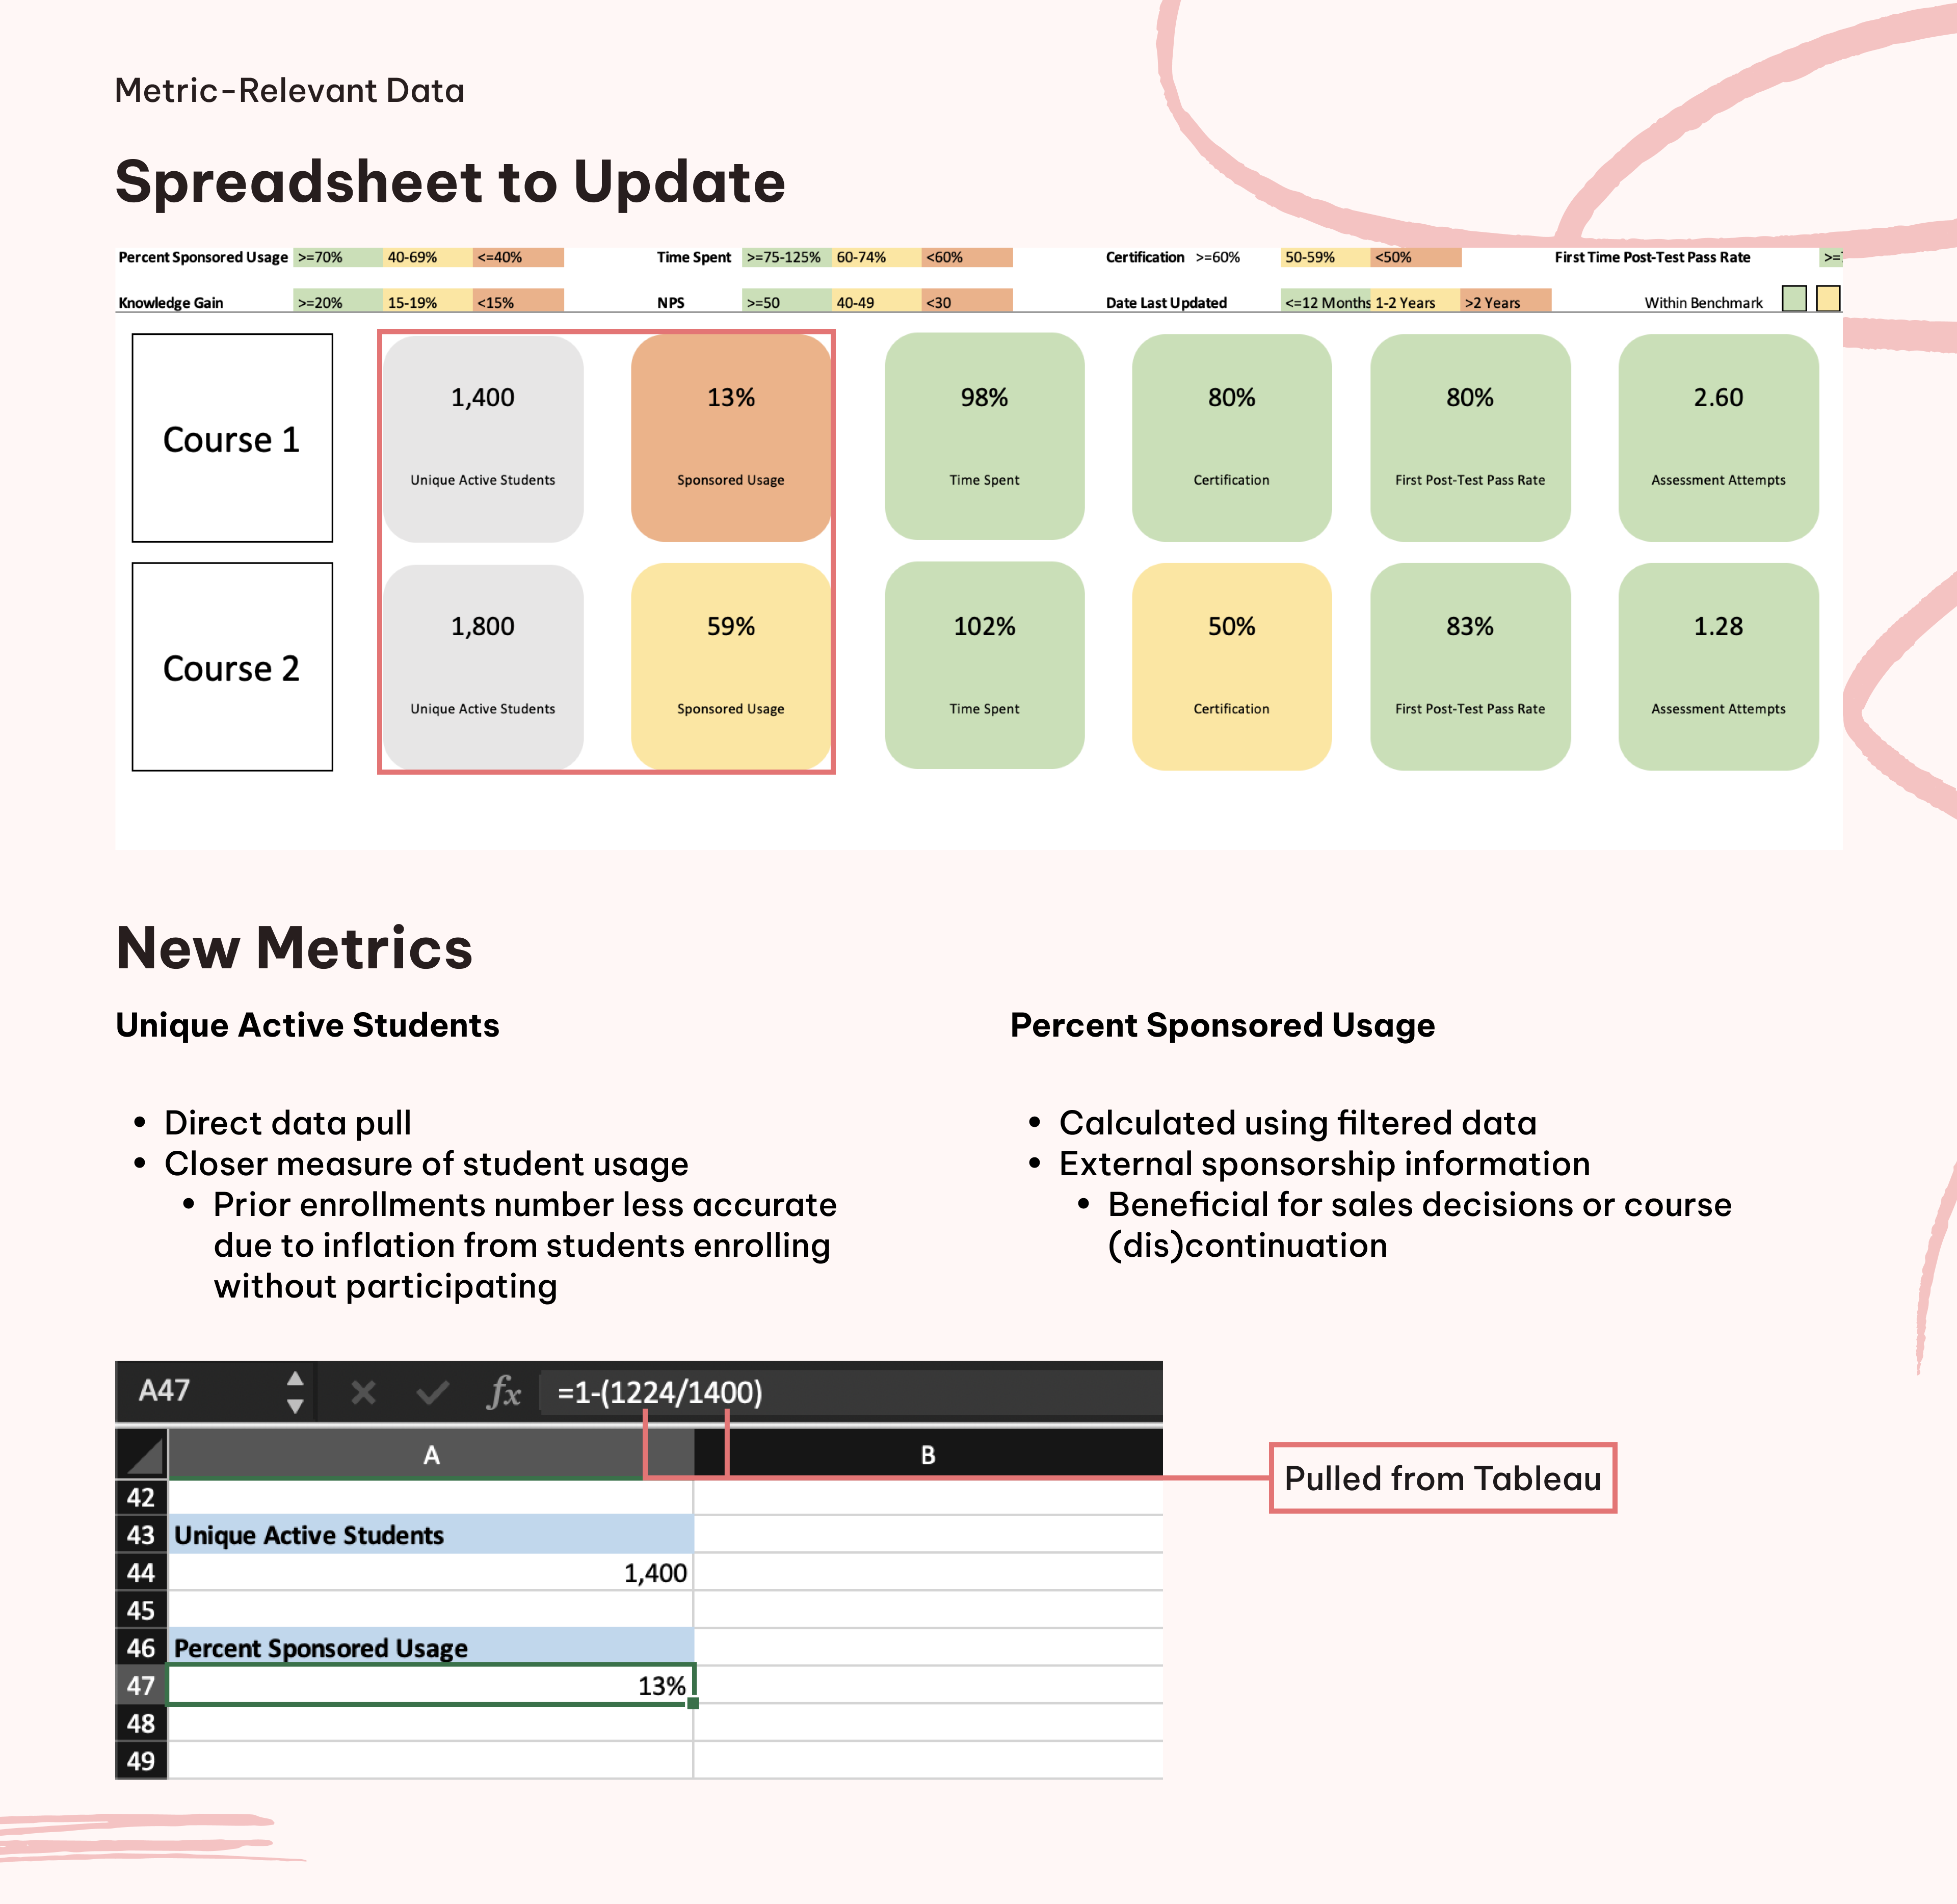
I made metric-related updates to add relevant insights for a business context: the number of unique active students and the percentage of sponsored usage. I pulled these additional data from a Tableau dashboard to better understand how well products were selling. The unique active students could provide a closer measure of students using each course than the previously used enrollments metric, whereas the percent sponsored usage could be used to make decisions on which courses to continue or push further sales for. I added both of these metrics to each course’s detailed spreadsheet as well as the overview. For clear understanding, I added descriptions in the “Read Me” documentation.
As a result of my work on the product health dashboard, it was refreshed as a more up-to-date and comprehensive data guide for all internal stakeholders to reference. My work was shared with the wider product team and leadership to inform everyone about how the product measured up against benchmarks.
For my own professional development, I improved my skills in Heap and Excel. Furthermore, this project helped me get comfortable with the SAFe model of delivering a usable product with every iteration. Though the product health dashboard was static and had to be manually updated, it was still a usable reference for seeing all the key metrics at once and serves the same purpose as a live dashboard with less development required. In updating the dashboard, I similarly became more familiar with using proxy measurements to estimate the average time while direct data tracking was being developed across a longer timeline.

I will get back to you within three business days.